Scratch off "RECESSION" and "RECOVERY" is all we hear now!

*Recovery is all we hear nowadays around us and Recovery is even a word "confirmed" now. Only time can cure the crisis but as the recovery is in the process, what are we doing now?
*As I've mentioned that this week we'll be having a minor market correction as world indices are unable to test their resistants.
*Despite the news from U.S economy, it is unable to boost the stock markets up.
*Next week will be a BRIGHTER week as technically we expect most of the world stock market indices to rebound from their important supports.
DJIA Daily Chart(Trend Analysis)

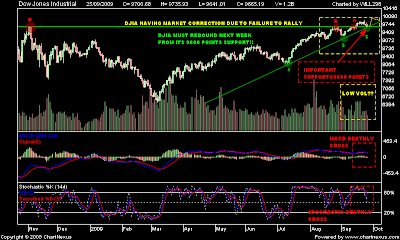
*DJIA closed perfectly above its important trend line support @ 9660 points due to market correction.
*Next week DJIA will need to rebound from this support in order to have a healthy rally.
*But Volume is always the MAIN indicator to be concern now. A High Volume is needed if DJIA were to rally towards its 10,000 psychological resistant.
DJIA Daily Chart(EMA20days & EMA30days)

*By applying EMA20days and EMA30days into DJIA Daily Chart we can see currently DJIA is at its EMA20days support. Can DJIA rebound from this support? If DJIA break this EMA20days support, automatically we'll be looking at its EMA30days support.
DJIA Weekly Chart(Bollinger Band)

*Using Weekly Chart + Bollinger Band to find your entry point in the market.
*DJIA is staying strong above its Bollinger Band Center Band Support. As we can see the Bollinger Band is contracting, there will be a chance where DJIA will rally either next week or early October.
SHANGHAI Daily Chart(EMA200days and EMA50days)

*ShangHai Index this week plunged down from it's resistant and is now standing above its EMA200days strong support.
*Note that the EMA200days is at 2783points. ShangHai Index MUST not break below this EMA200days support.
*A rebound from EMA200days is expected from this stage now for ShangHai Index.
 *ShangHai Index Weekly Chart is indicating that they are still in a correction. EMA50days is the important support now to look at. EMA50days is @2783points in the Weekly Chart.


SHANGHAI Weekly Chart(EMA50days)
 *ShangHai Index Weekly Chart is indicating that they are still in a correction. EMA50days is the important support now to look at. EMA50days is @2783points in the Weekly Chart.
*Both Momentum and MACD are showing us that ShangHai is still in a market correction process.
HangSeng Daily Chart(Trend Line Analysis)

Straits Times Daily Chart (Trend Line Analysis)

No comments:
Post a Comment